Four Frameworks to Help You Define Product Metrics
Metrics Management is a core skill for a Product Manager and a core task within that is defining product metrics.
The Association of Product Professionals defines Metrics Management as “Defines, tracks, and reports on relevant, actionable product metrics and performance to agreed goals.”
Whether that be, defining outcomes for your product, defining metrics to monitor product health or defining metrics to validate experiments. This is a core skill for product people.
Something that comes up frequently in my 1:1 coaching sessions with Product Managers is where to start when defining product metrics.
They have an idea of what metrics they’ll like to track — or perhaps what metrics they already have but they struggle with putting structure around it — a framework — even if that’s simply to give confidence that they’re not missing anything.
So, I thought I’d write about 4 tools/frameworks/strategies I commonly use to define Product Metrics.
Why frameworks?
You can find numerous articles out there that will rattle off a list of “essential e-commerce metrics” or “metrics for startup PMs” however the universal problem with these types of articles are that you end up tracking metrics without fully understanding why or how they interplay and impact your product.
Every product, company, situation is different and although I can surely rattle off a list of metrics that are almost universally used it would not be as impactful as giving you a tool, a method for defining your own.
Part of my role as a coach is to teach Product Managers how to fish, not fish for them, so to speak.
Therefore, I want to give you a way for you to define metrics that are relevant to you and your unique context.
You may have heard of some of these frameworks before, regardless I hope you find this useful.
1. Google HEART framework
Developed by the Google research team, this framework is designed to help facilitate defining metrics around user happiness, engagement, adoption, retention and tasks success.
Happiness: How do your users think about your product? Do they enjoy using it? How does your product make them feel? Typically measured by satisfaction surveys, in app ratings and net promoter score, happiness is all about your users feelings and emotions towards your product.
Engagement: How often are your users using the product? Do they return and for how long? Engagement is typically measured by the number of active users you have, how long their sessions last, how often the return and what key actions are they taking when they do?
Adoption: How many users are adopting your product? Adoption is typically measured as a percentage of the number of users who registered vs those who completed onboarding or adopted a new feature.
Retention: What percentage of users continue to return to the product? Retention is typically measured by churn or daily/monthly active users.
Task success: Can users achieve their desired goals? How long does it take for them to achieve that goal? Task success is the most tailored metric; however it is typically measured by time to completion, error rate, bounce rate and how many times they perform a certain action.
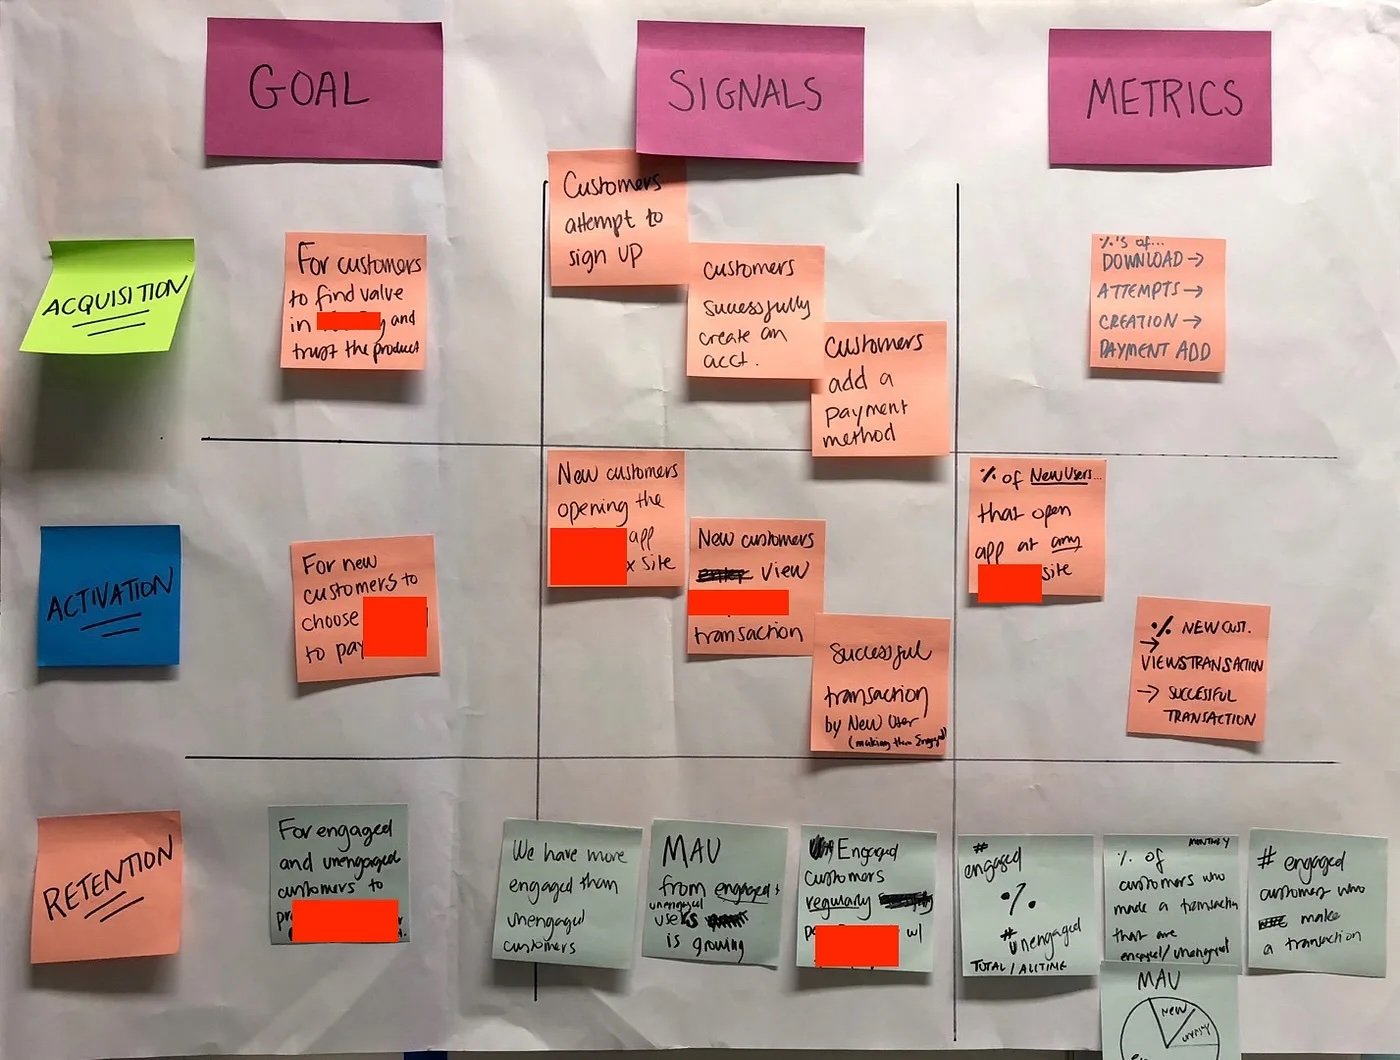
The Google HEART framework leverages a 2x2 table with the key metric themes along the left and three boxes for Goals, Signals and Metrics along the top.
The framework is designed to facilitate setting goals for each section.
For example what are the happiness goals you desire for your customers? Do you hope they find it easy to use, become advocates and possibly convince their friends and familys to register?
The second step is to look at how each of your goals relates to a user action.
By mapping your goals to actions you formulate a list of potential signals that would suggest you are achieving your goal(s).
Finally we then convert these signals into actionable metrics that you can record and monitor — for example a Net Promoter Score of 65+.
Google HEART Framework exampleExample Google HEART metrics for a mobile app I worked on a while back2. Pirate Metrics
Pirate metrics was coined by Dave McClure, a serial entrepreneur. The name came from it’s acronym AARRR, standing for:
Acquisition: How are customers discovering your product? How many are adopting it?
Activation: How many customers are signing up and using the product?
Retention: How many of the active customers are continuing to use the product ongoing?
Referral: Do your customers tell others about the product?
Revenue: Is the business making a return on investment with this product?
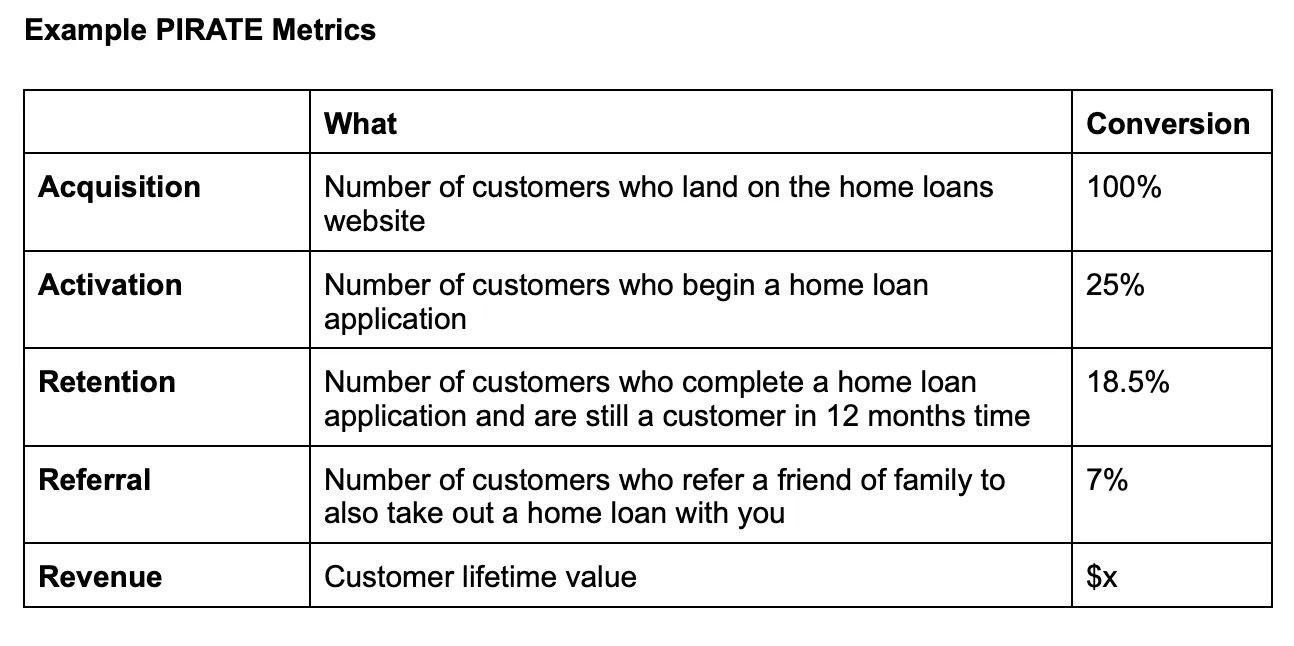
Pirate metrics work well for products and services that have a clear conversion funnel.
For example am ecommerce store or an online application loan application form would be ideal for pirate metrics.
You could imagine a conversion funnel such as:
Example of Pirate Metrics for Home Loans application process.Example pirate metrics and conversion funnel for a mobile app — note you can see both iOS and Android conversion.🔥Pro Tip🔥: You can even use Pirate Metrics or any other form of conversion funnel to organise your Product Backlog. This is a great way for using this data to drive prioritisation.
3. Impact Mapping
Impact Mapping was introduced by Gojko Adzic in 2012. It is a visual and interactive way for teams to set strategic goals.
Impact mapping is a lightweight, collaborative planning technique for teams that want to make a big impact with software products. It is based on user interaction design, outcome driven planning and mind mapping. — impactmapping.org
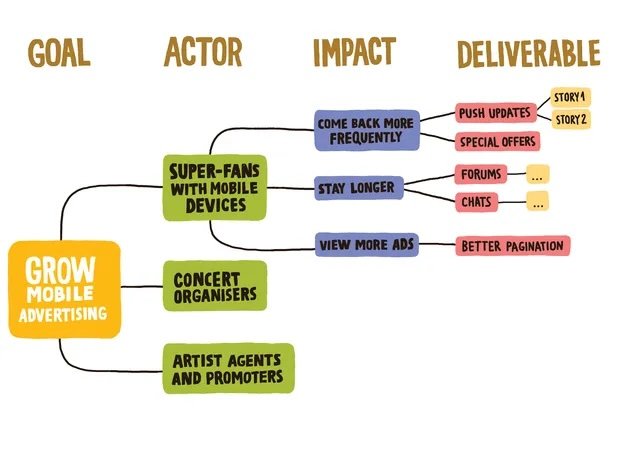
Impact maps have 4 components or layers:
GOAL: The cornerstone of an impact map is the goal. This is the ‘why’, the strategic outcome that you wish to achieve.
ACTOR: The first branch from the goal is the ‘actor’ this is typically the customer or user — who’s behaviour do we need to change to achieve the desired outcome?
IMPACT: The next branch from the actor is the impact. This is the behavioural change we must see in the actor to achieve the strategic outcome — what impacts are we trying to create? Here is where you begin to identify potential leading indicators to the central goal.
DELIVERABLE: Once you have answered the above three layers you can begin ideating ways you might achieve the desired impact for your target customer/user (actor) — how might we achieve this desired impact?
Impact mapping is a great exercise for the whole team and for Product Managers to do with stakeholders.
Impact maps help facilitate the conversion around what outcomes we’d like to achieve and who we might target to achieve them. They also open the door for having more than one solutions to a single impact or outcome.
I find the last part to be really powerful for organisations where there is more emphasis on solutions over outcomes.
Impact maps can be a great tool to even ‘work-backwards’ from a solution to facilitate a conversation on the outcome we are really trying to achieve.
Example impact map — credit impactmapping.org🔥Pro Tip🔥: Check out the ImpactMapping.org’s cheatsheet here. It’s a fantastic guide. There is also loads of material on the site and you can always purchase Gojko Adzic’s book.
4. Custom
Feeling more advanced? You can always create your own framework or go off script.
For example, in this strategy workshop I did with a client. I worked with the VP of Product’s leadership team to mapped out their product portfolio goals based on the business goals for the quarter. Breaking each down into leading indicators.
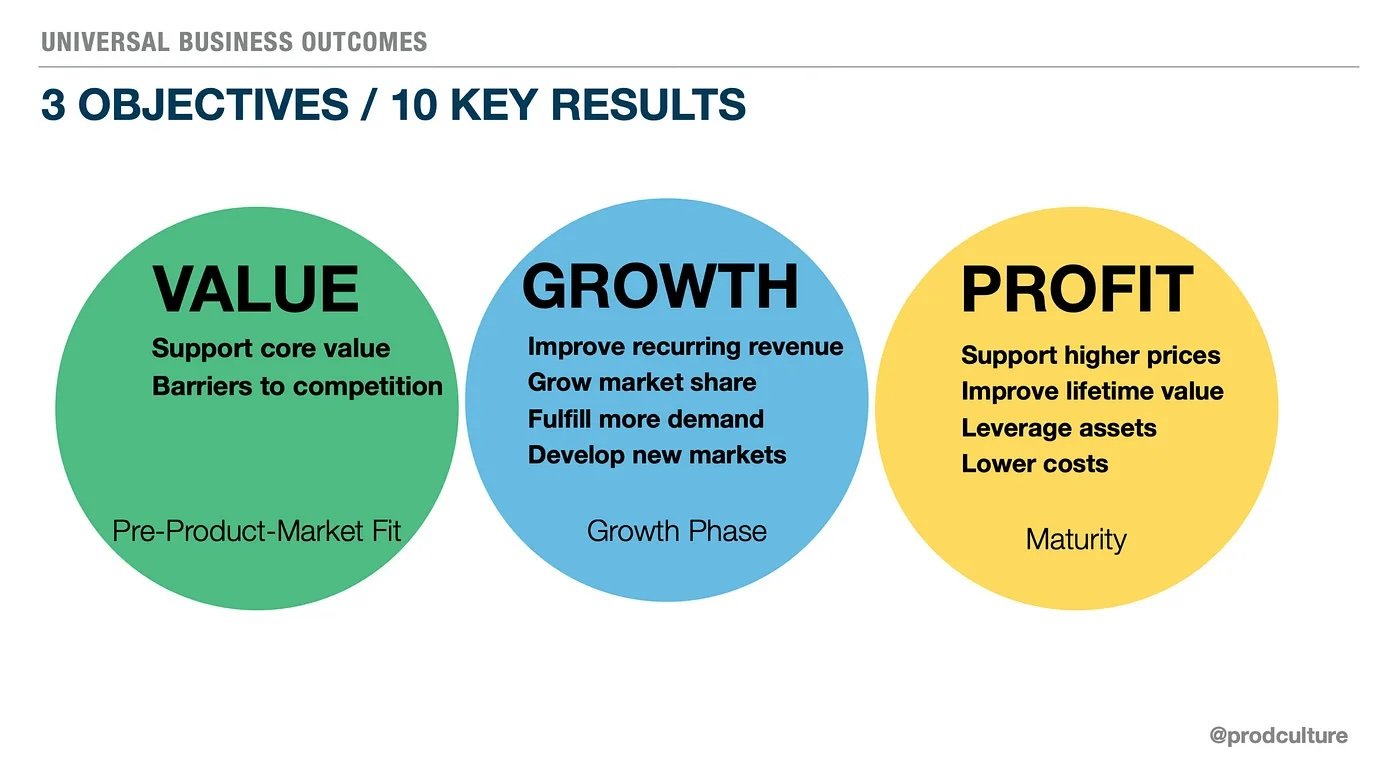
Bruce McCarthy from Product Culture and author of Product Roadmaps Relaunched puts product metrics into one of three buckets.
Value: Support core value and overcome barriers to competition.
Growth: Improving recurring revenue, grow market share, fulfil more demand and develop into new markets.
Profit: Support higher prices, improve customer lifetime value, leverage assets and lower costs.
Slide from Bruce McCarthy talk at Leading the Product, credit Bruce McCarthyI have coached Product Managers who have used this as a baseline to then brainstorm metrics from.
Another option is to start with a the business goal and work backwards — or perhaps even start with your top challenges and work backwards from there.
More often than not, simply getting things down on paper (or Miro) and sythesising, finding relationships, etc is a powerful place to begin. Over time the chaos will start to make sense.
Leading vs Lagging indicators
Finally when defining metrics it’s important to consider whether your metrics are leading vs lagging.
Lagging indicators are ones that are often only realised over a long time horizon. Whereas leading indicators are measure that suggest that you are progressing towards your lagging indicator.
I often like to use a garden analogy here.
Imagine you are building a vegetable patch in your backyard, you decided to plant a variety of vegetables, like carrots. Your ideal outcome is that you no longer need to buy vegetables because you have all the vegetables you need growing in your backyard.
It’s easy to realise that you will not achieve this goal for several weeks at the earliest. Further if this was your only measurement — no longer buying vegetables — then you could be waiting several months before you realise that something might not be right — this a lagging indicator.
Here is where leading indicators come in.
What might some of the signs be that your vegetable patch is succeeding? What indicators would you look for?
For example you may test the humidity in the soil or its composition, these can be categorised as inputs.
Inputs are a form of leading metric. In this example we believe that having the right soil and foundation for the seeds to grow will increase our chances to successfully grow our vegetables.
Next you might measure signs of growth. We may measure how many seeds we planted vs how many have sprouted.
This is still a leading indicator as there is still no guarantee the sprouts will lead to fully grown vegetables, but they’re an indication that we’re heading in the right direction.
Finally we might measure the sprouts growth rate and therefore predict when they will be ripe and of course we would measure the final outcome of harvesting delicious vegetables and whether or not we still need to purchase them.
Analogy for Leading vs Lagging indicators using growing vegetablesLeading and lagging indicators are ultimately a spectrum from today until you realise your ultimate goal.
What you need to ask yourself when defining metrics is “how long will it take to get feedback and know you’re succeeding?” the longer this time lapse is, the more you will want to consider adding leading indiactors into the mix.
Wrap Up
It’s important to remember that regardless of what framework you use, whether it’s a custom one or not, to be mindful of your product’s context — your current goals and user challenges that you are solving.
Metrics are only useful when they are meaningful.
You will find many articles out there that will rattle off a list of “essential e-commerce metrics” or “metrics for startup PMs” the universal problem with them all is that you’re tracking metrics without fully understanding why you are tracking them, or how they interplay/impact your product.
For example MRR (montly reocurring revenueue) is great but what if your product is not a subscription one? What if you are actually selling a physical product?
The point is to ensure that any metric you set or decide to track you have a clear understanding of “why” you are tracking it — what the link is to your product, the experiments you are currently performing, your business goals and the challenges you are currently prioritising to solve for your users.
Need help with communication or other aspects of product management? I can help in 4 ways::
Level up your craft with self-paced deep dive courses on specific topics such as Prioritisation, Stakeholder Management and more.
1:1 Coaching/Mentoring: I work with product people and founders through 1 hour virtual sessions where I help them overcome challenges.
Private Workshops and Training: I frequently run private workshops and tailored training courses for product teams globally. Get in touch to talk about your unique training needs.


